Linear Equations and Inequalities
Easy learning with videos, exercises, tasks, and worksheets
Most popular videos
Content
Introduction
A linear equation is the equation of a line, and the graphs of linear equations always display a straight line. All linear equations must include variables such as x and y and may include a constant or coefficient to a variable but there will be no exponent.
Here is an example of a linear equation and some points on the line $y=2x +4$. A chart is a handy tool you can use to create a list of some of the ordered pairs of an equation. Because the equation is linear, the graph of this set of points is a straight line.
$y=2x +4$
$\begin{array}{|lrl|} \hline&&\\[-3mm] & \mathbf{x}& \mathbf{y}\\[0.5mm] \hline&&\\[-3mm] & -2 & 0\\[0.5mm] & -1 & 2\\[0.5mm] & 0 & 4\\[0.5mm] & 1 & 6\\[0.5mm] & 2 & 8\\[0.5mm] \hline \end{array}$
Slope
The slope of a line is the slant or incline of a line. Slope can be a positive or negative number.The symbol m is used to represent the slope. Use the slope formula to calculate the value of the slope equal to the change of y divided by the change of x.
$m=\frac{y_2-y_1}{x_2-x_1}$
Example: Find the slope of the line that passes through points (2, 11) and (3, 9).
$m=\frac{9-11}{3-2} = \frac{-2}{1}= -2$
The slope is equal to -2. The negative sign indicates a downward slope.
Writing Linear Equations
Although there are several formulas for writing equations of lines, linear equations are most often presented in the Slope-Intercept form.
Slope-Intercept Form
$y=mx+b$
- m is the slope of the line
- b is the y-intercept
Standard Form
The standard form of a line is another format to present the same information as the slope-intercept form.
$Ax+By=C$
A, B, and C are coefficients or constants.
To change from standard form to slope-intercept form, use opposite operations to move the terms.
$\begin{align} Ax+By&=C\\ -3x + y &= 16\\ -3x +3x + y &= 16 +3x\\ y &= 3x +16 \end{align}$
$\begin{align} y&=mx+b\\ y &= 3x +16 \end{align}$
Writing the equation in the slope-intercept form makes it easier to determine the slope of this line is 3, and the y-intercept is 16.
Point-Slope Form
The point-slope form is used to calculate an unknown point when the slope and one point on the line is known.
$ (y-y_1)=m(x-x_1)$
y and x are unknown values. $y_1$ and $x_1$ are a known ordered pair.
Use the point-slope form to write the equation of the line with a slope of 1 and passing through point (3, 4).
$\begin{align} (y-y_{1})&=m(x-x_{1})\\ (y-4)&=1(x-3)\\ y -4 &= x -3\\ y - 4 + 4 &= x -3 +4\\ y&=x + 1 \end{align}$
Graphing Linear Equations
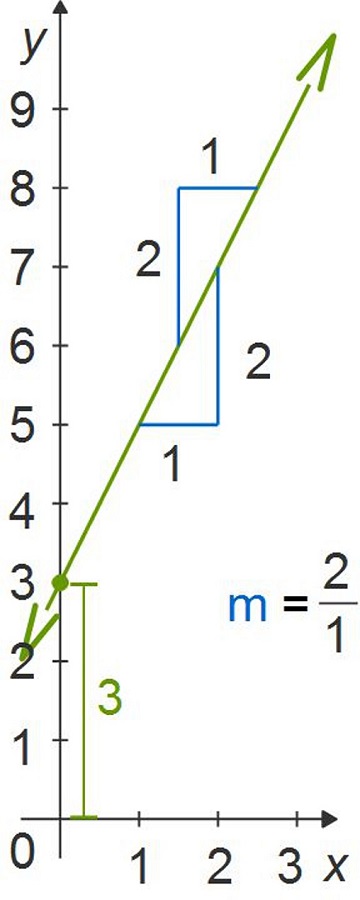
Use the information found in the equation of a line written in slope-intercept form to create the matching graph.
$\begin{align} y&=mx+b\\ y &= 2x +3 \end{align}$
For this linear equation, the slope is 2 and the y-intercept is 3.

Parallel and Perpendicular Lines
The slope can be used to indicate if lines are parallel or perpendicular:
- Parallel lines: slopes are equal
- Perpendicular lines: slopes are negative inverses
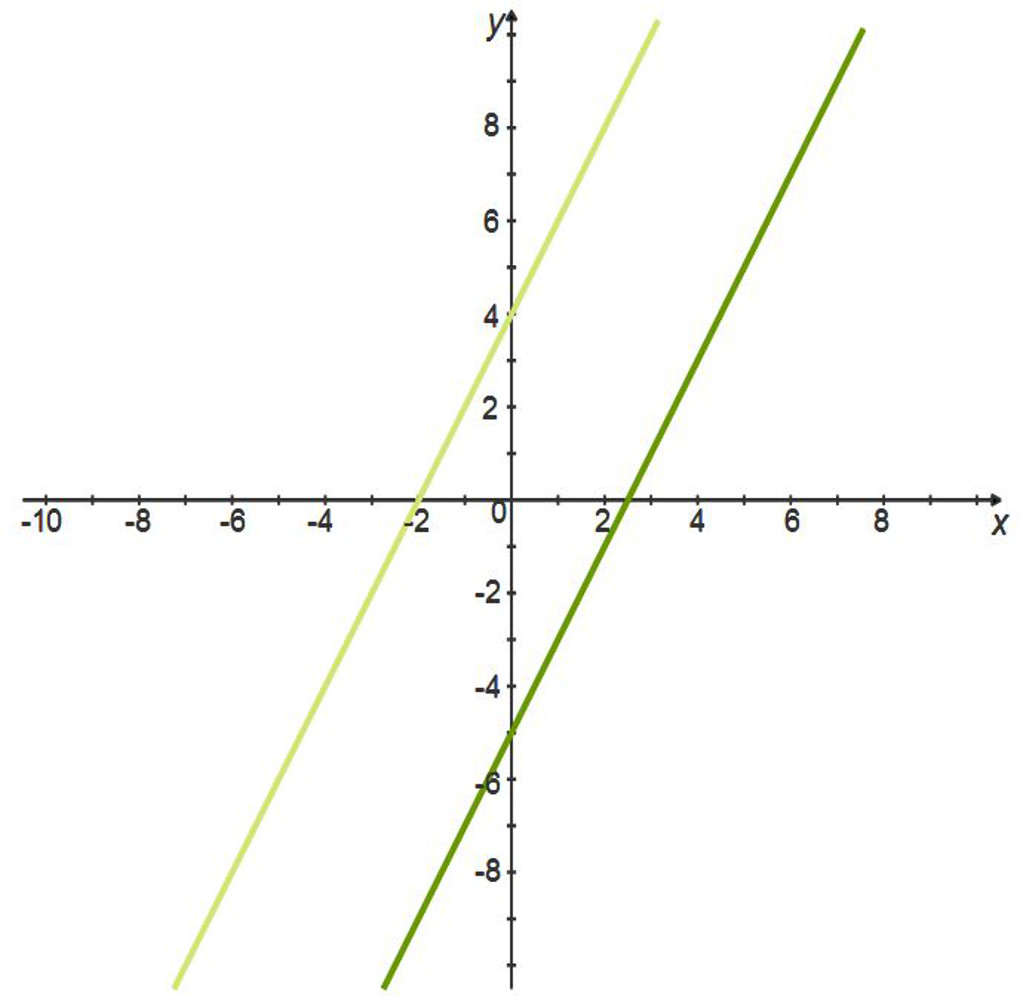
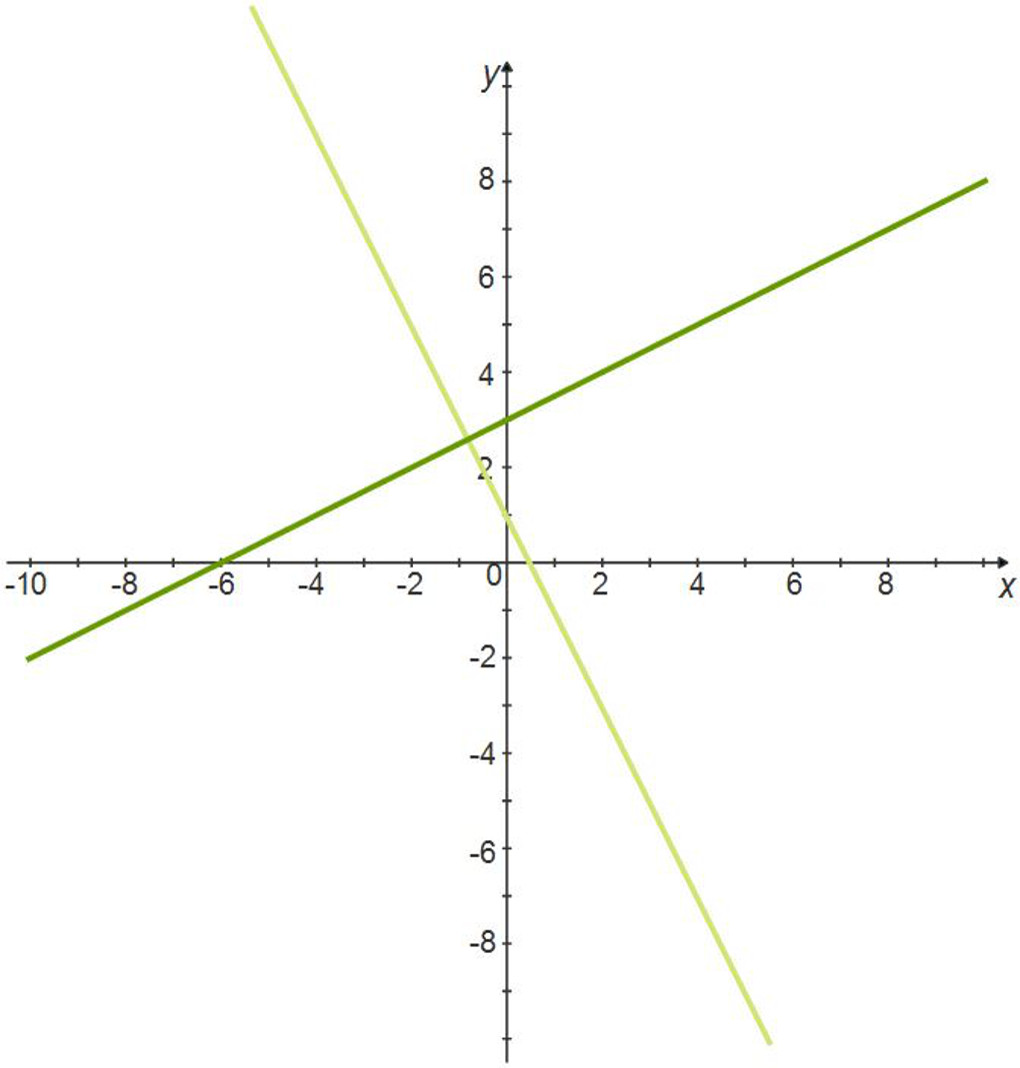
Example: For this problem, are the slopes parallel or perpendicular? Compare the equation of two lines. What do you know about the slopes?
$\begin{align} y&=2x +4\\ y&=2x -5 \end{align}$
The slopes are the same, so the lines are parallel.

$\begin{align} y&= -2x+1\\ y&=\frac{1}{2}x+3\\ \end{align}$
The slopes are negative inverses (the product of the two slopes is equal to -1), so the lines are perpendicular.

Direct Variation
When the value of y varies with the value of x, there is a direct variation. The formula for direct variation is:
$\begin{align} y&= k\times x\\ y&= kx \end{align}$
k is the constant of variation. The formula for k is: $k=\frac{y}{x}$
Example: This problems demonstrates a real world use of direct variation. A car gets 20 miles per gallon. How many gallons of gas are needed to travel a distance of 2,400 miles? Use the direct variation to solve for x.
$\begin{align} y&= kx\\ y&=20x\\ 2,\!400 &= 20x\\ \frac{2,\!400}{20} &= \frac{20}{20}x\\ x&=120 \end{align}$
With a constant of variation of 20, the car will need 120 gallons to travel 2,400 miles.
Graphing Linear Inequalities
Graphing linear inequalities is a multi-step process. First graph the line. Then determine if the graph includes the line and if the solution set is above or below the line.
Example 1: For this inequality, the line is not included, and the solution set is below the line. $y<3x +4$

Example 2: But for this inequality, the line is included, and the solution set is above the line. $y\geq\frac{1}{2}x +5$.

All videos on the topic
Videos on the topic
Linear Equations and Inequalities (9 videos)
All worksheets on the topic
Worksheets on the topic
Linear Equations and Inequalities (9 worksheets)


 Slope
Slope
 Direct Variation
 Slope-Intercept Form
 Standard Form
 Point-Slope Form
 Graphing Linear Equations
 Writing Linear Equations
 What are Parallel and Perpendicular Lines?
 Graphing Linear Inequalities


